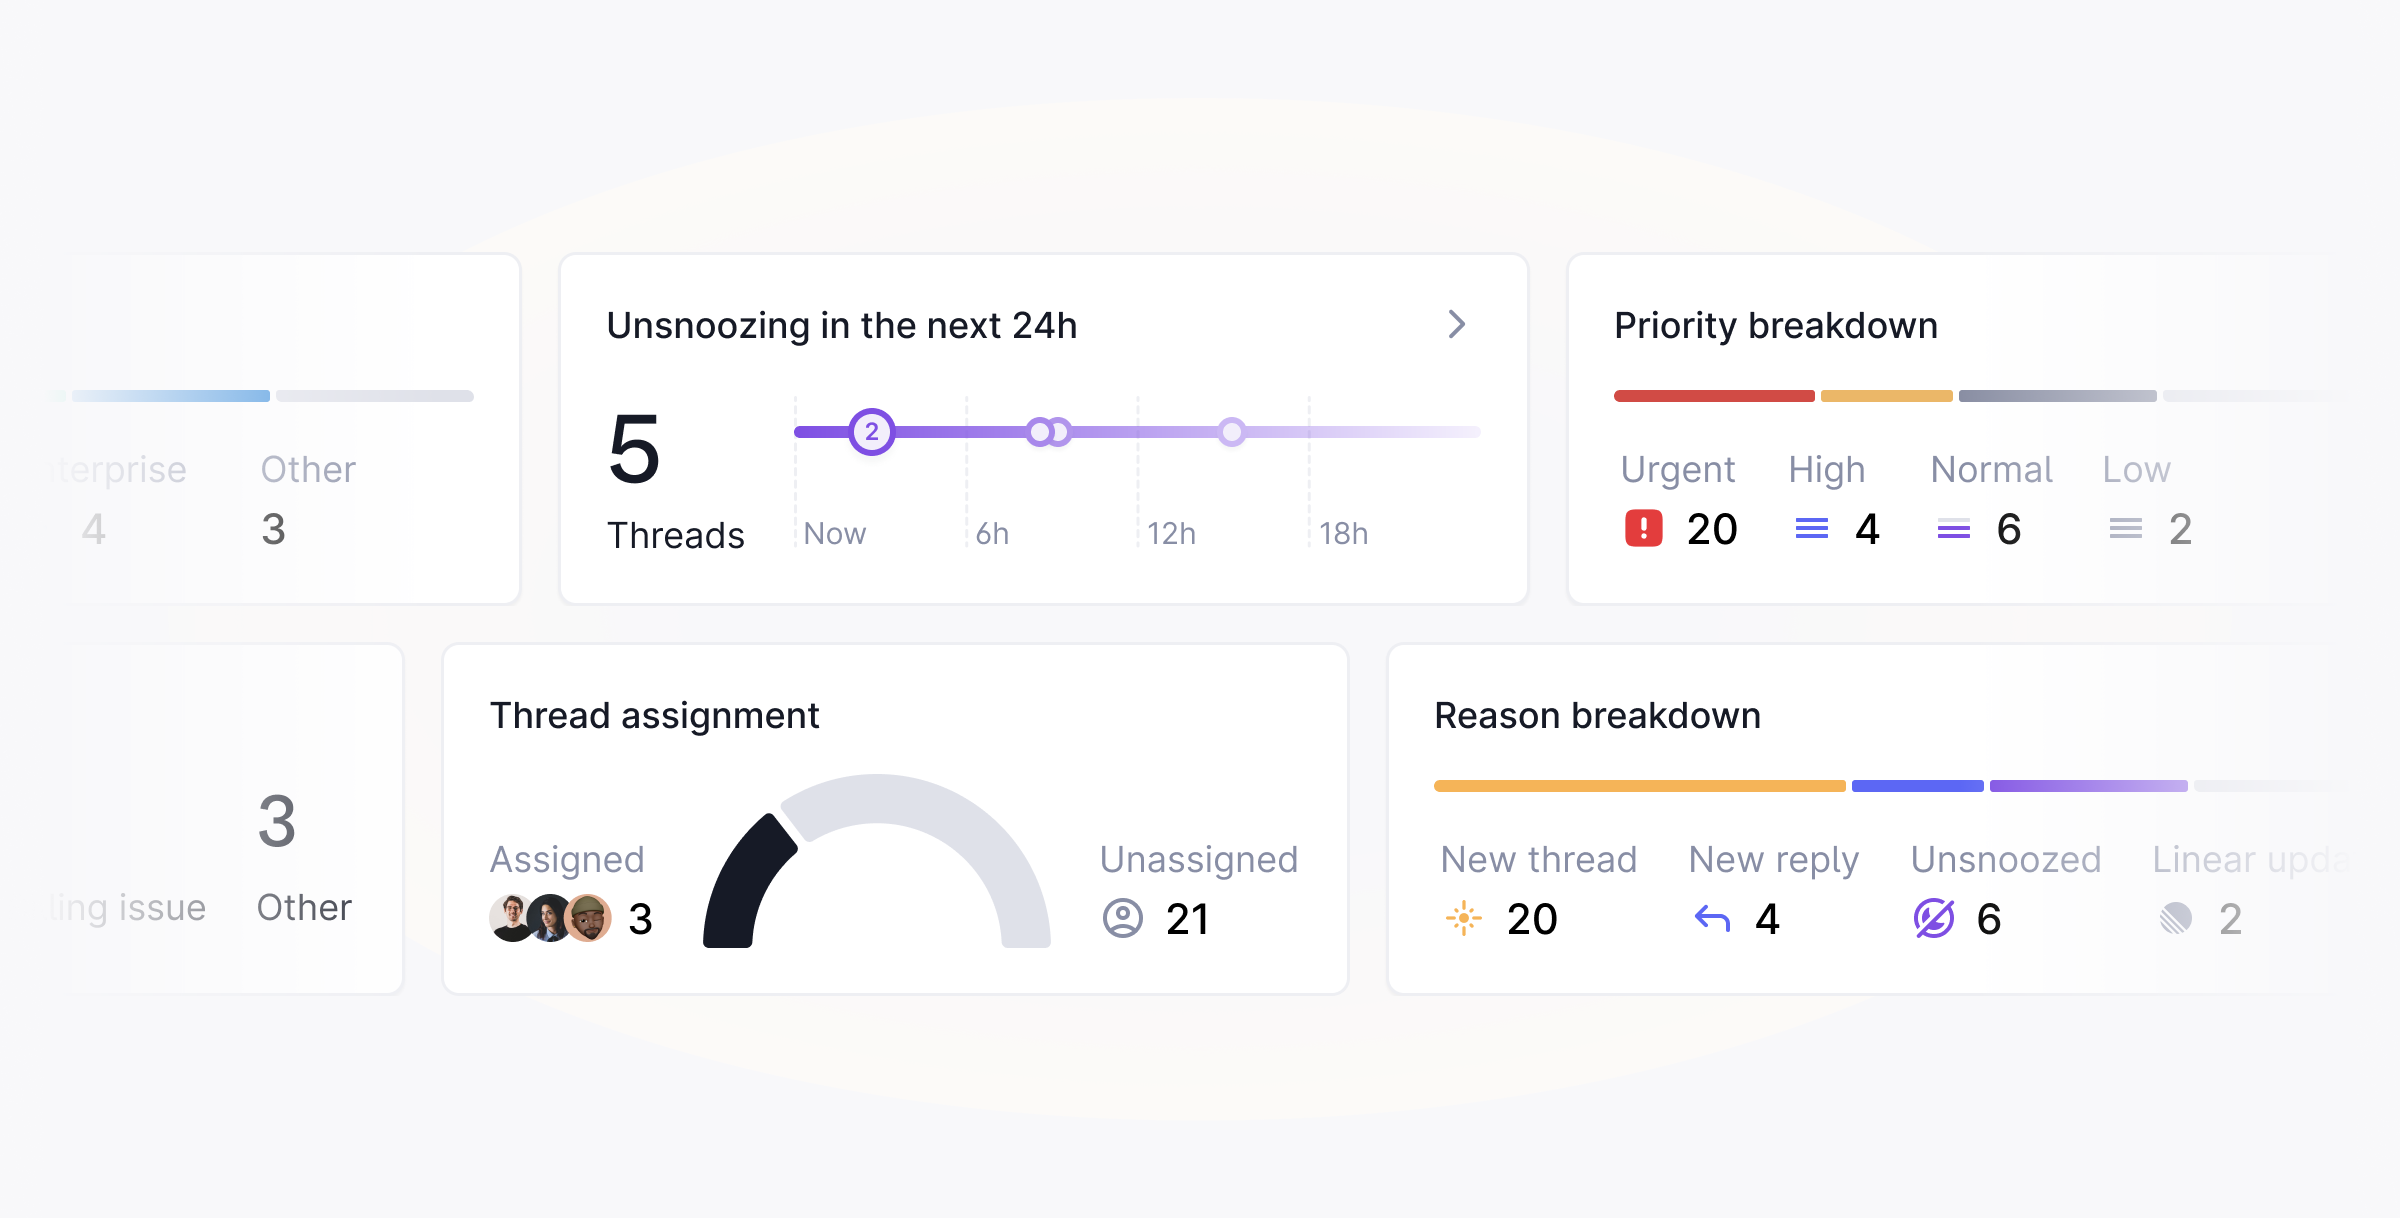
- The breakdown of why a thread is in
Todo(whether it’s new threads, replies, Linear issues, etc.) - Distribution of threads by priority
- A preview of how many threads will be unsnoozed in the next 24 hours
- Counts of assigned vs. unassigned threads
- Breakdown of threads by customer group
- Count of threads by label